Table of contents
What we will be building
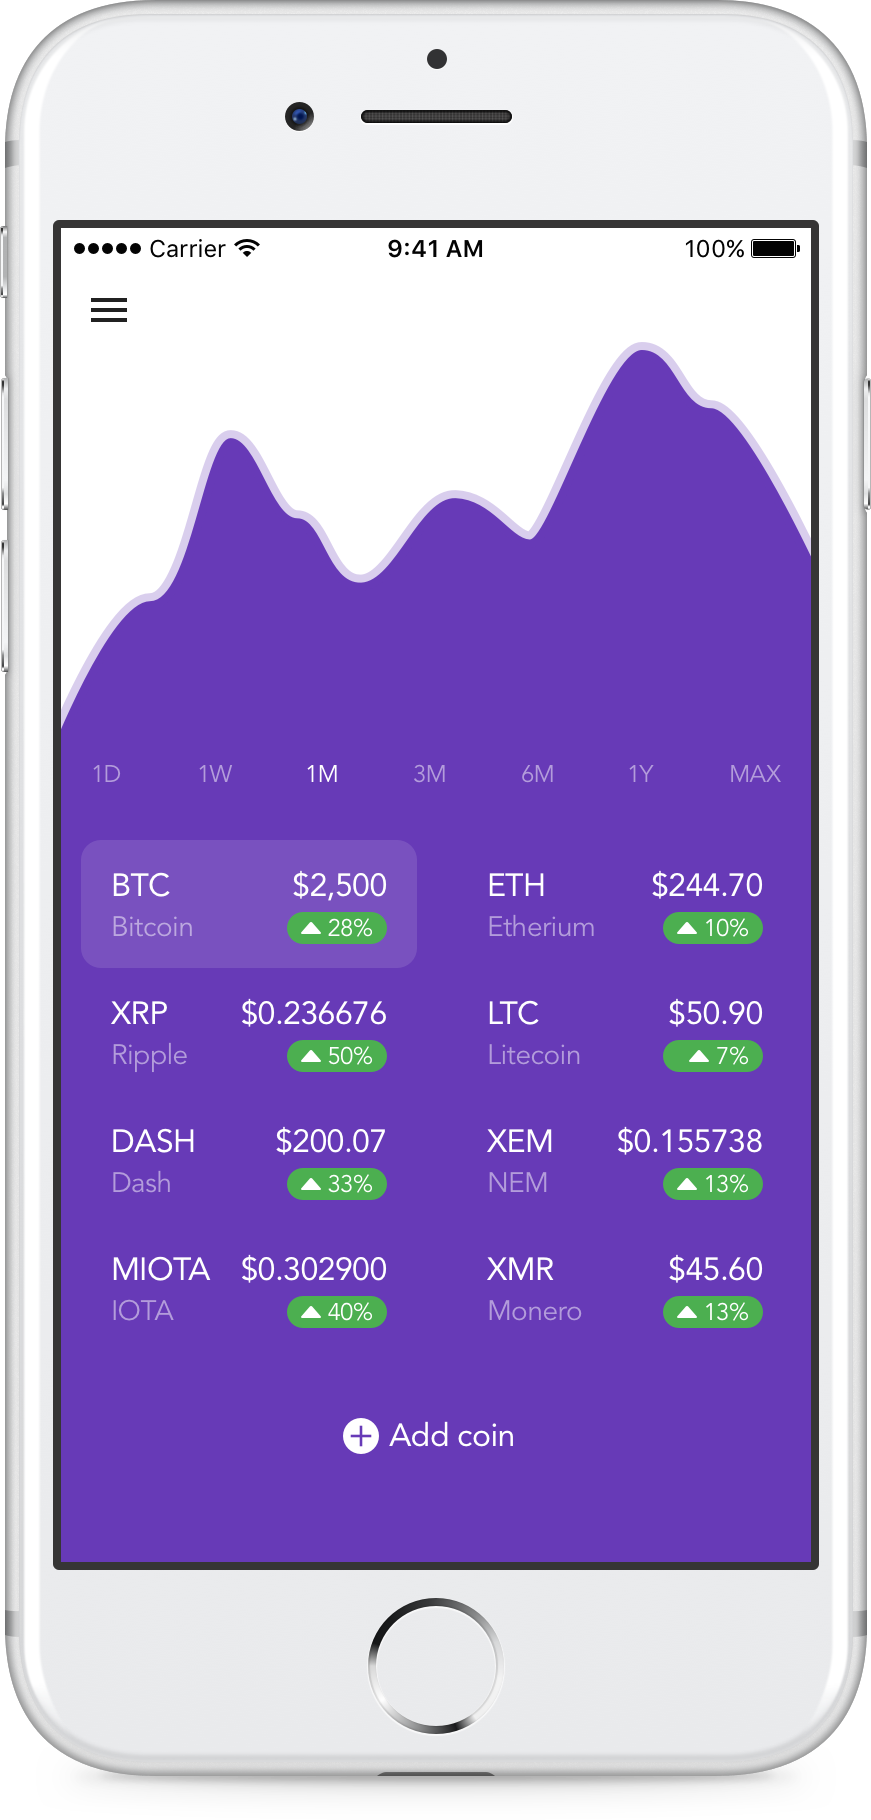
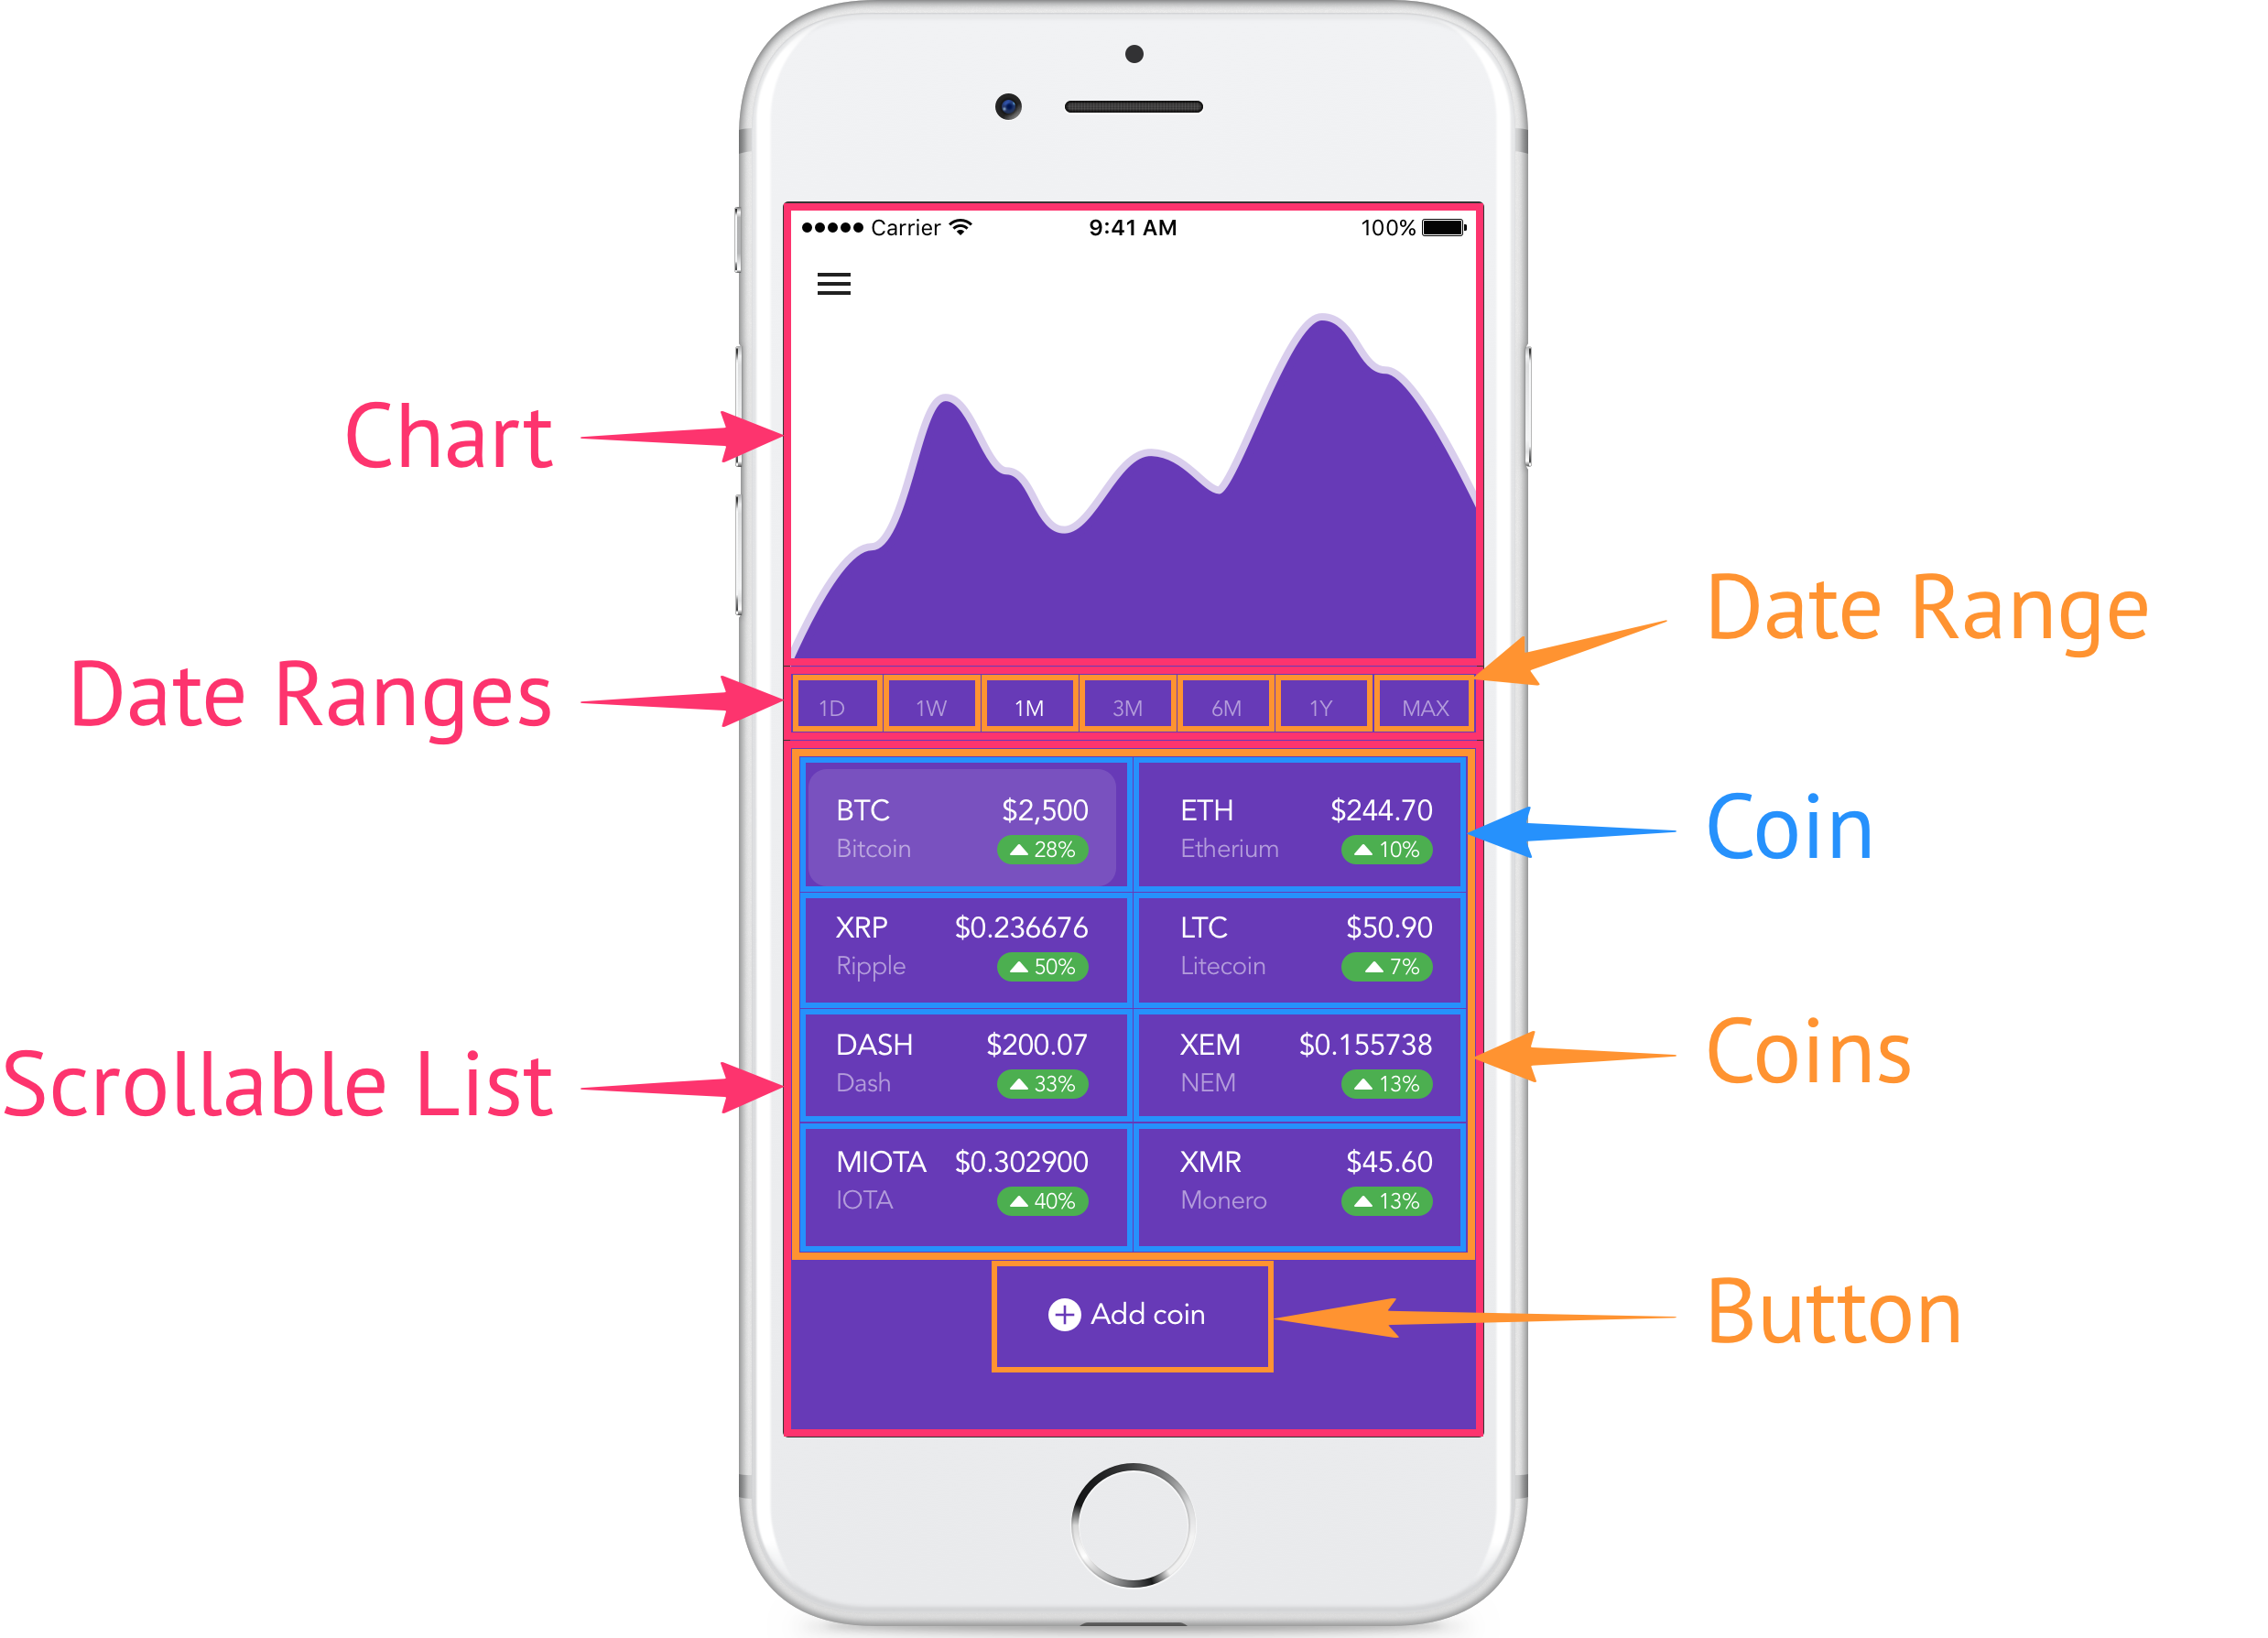
We’re going to build an app that has a chart and a list of crypto coins along with their prices and price changes in last 24 hours. Each coin when tapped on updates the chart with its price history.
In this part of the series, we’ll get started, install all dependencies, and build the chart part of the app. And we’ll continue building the rest of the app in the next parts.
For your reference, the final code for the app we’re building can be found in this GitHub repo.
Creating a new project
Let’s start off by creating a new app. Open Terminal App and run these commands to initialize a new project.
react-native init CoinsChart;
cd CoinsChart;
Installing dependencies
First of all, let’s install a couple of dependencies.
- Redux for storing and managing the data fetched from the API.
npm install --save redux react-redux
- Redux Thunk for calling asynchronous Redux actions.
npm install --save redux-thunk
- Lodash for working with arrays and objects.
npm install --save lodash
- Numeral for formatting prices.
npm install --save numeral
- React Native Vector Icons for rendering up and down arrow icons.
npm install --save react-native-vector-icons;
react-native link react-native-vector-icons;
- Babel plugin for enabling ES7 decorators.
npm install --save-dev babel-plugin-transform-decorators-legacy
Update .babelrc
Next, we need to update .babelrc to enable ES7 decorators.
- Open
.babelrcfile and addtransform-decorators-legacyplugin that we just installed:
{
  "presets": ["react-native"],
  "plugins": ["transform-decorators-legacy"]
}
ART
ART is a vector drawing API that we’ll be using for drawing the chart.
- Let’s install it and link the dependencies first.
npm install art --save;
react-native link art;
- Open
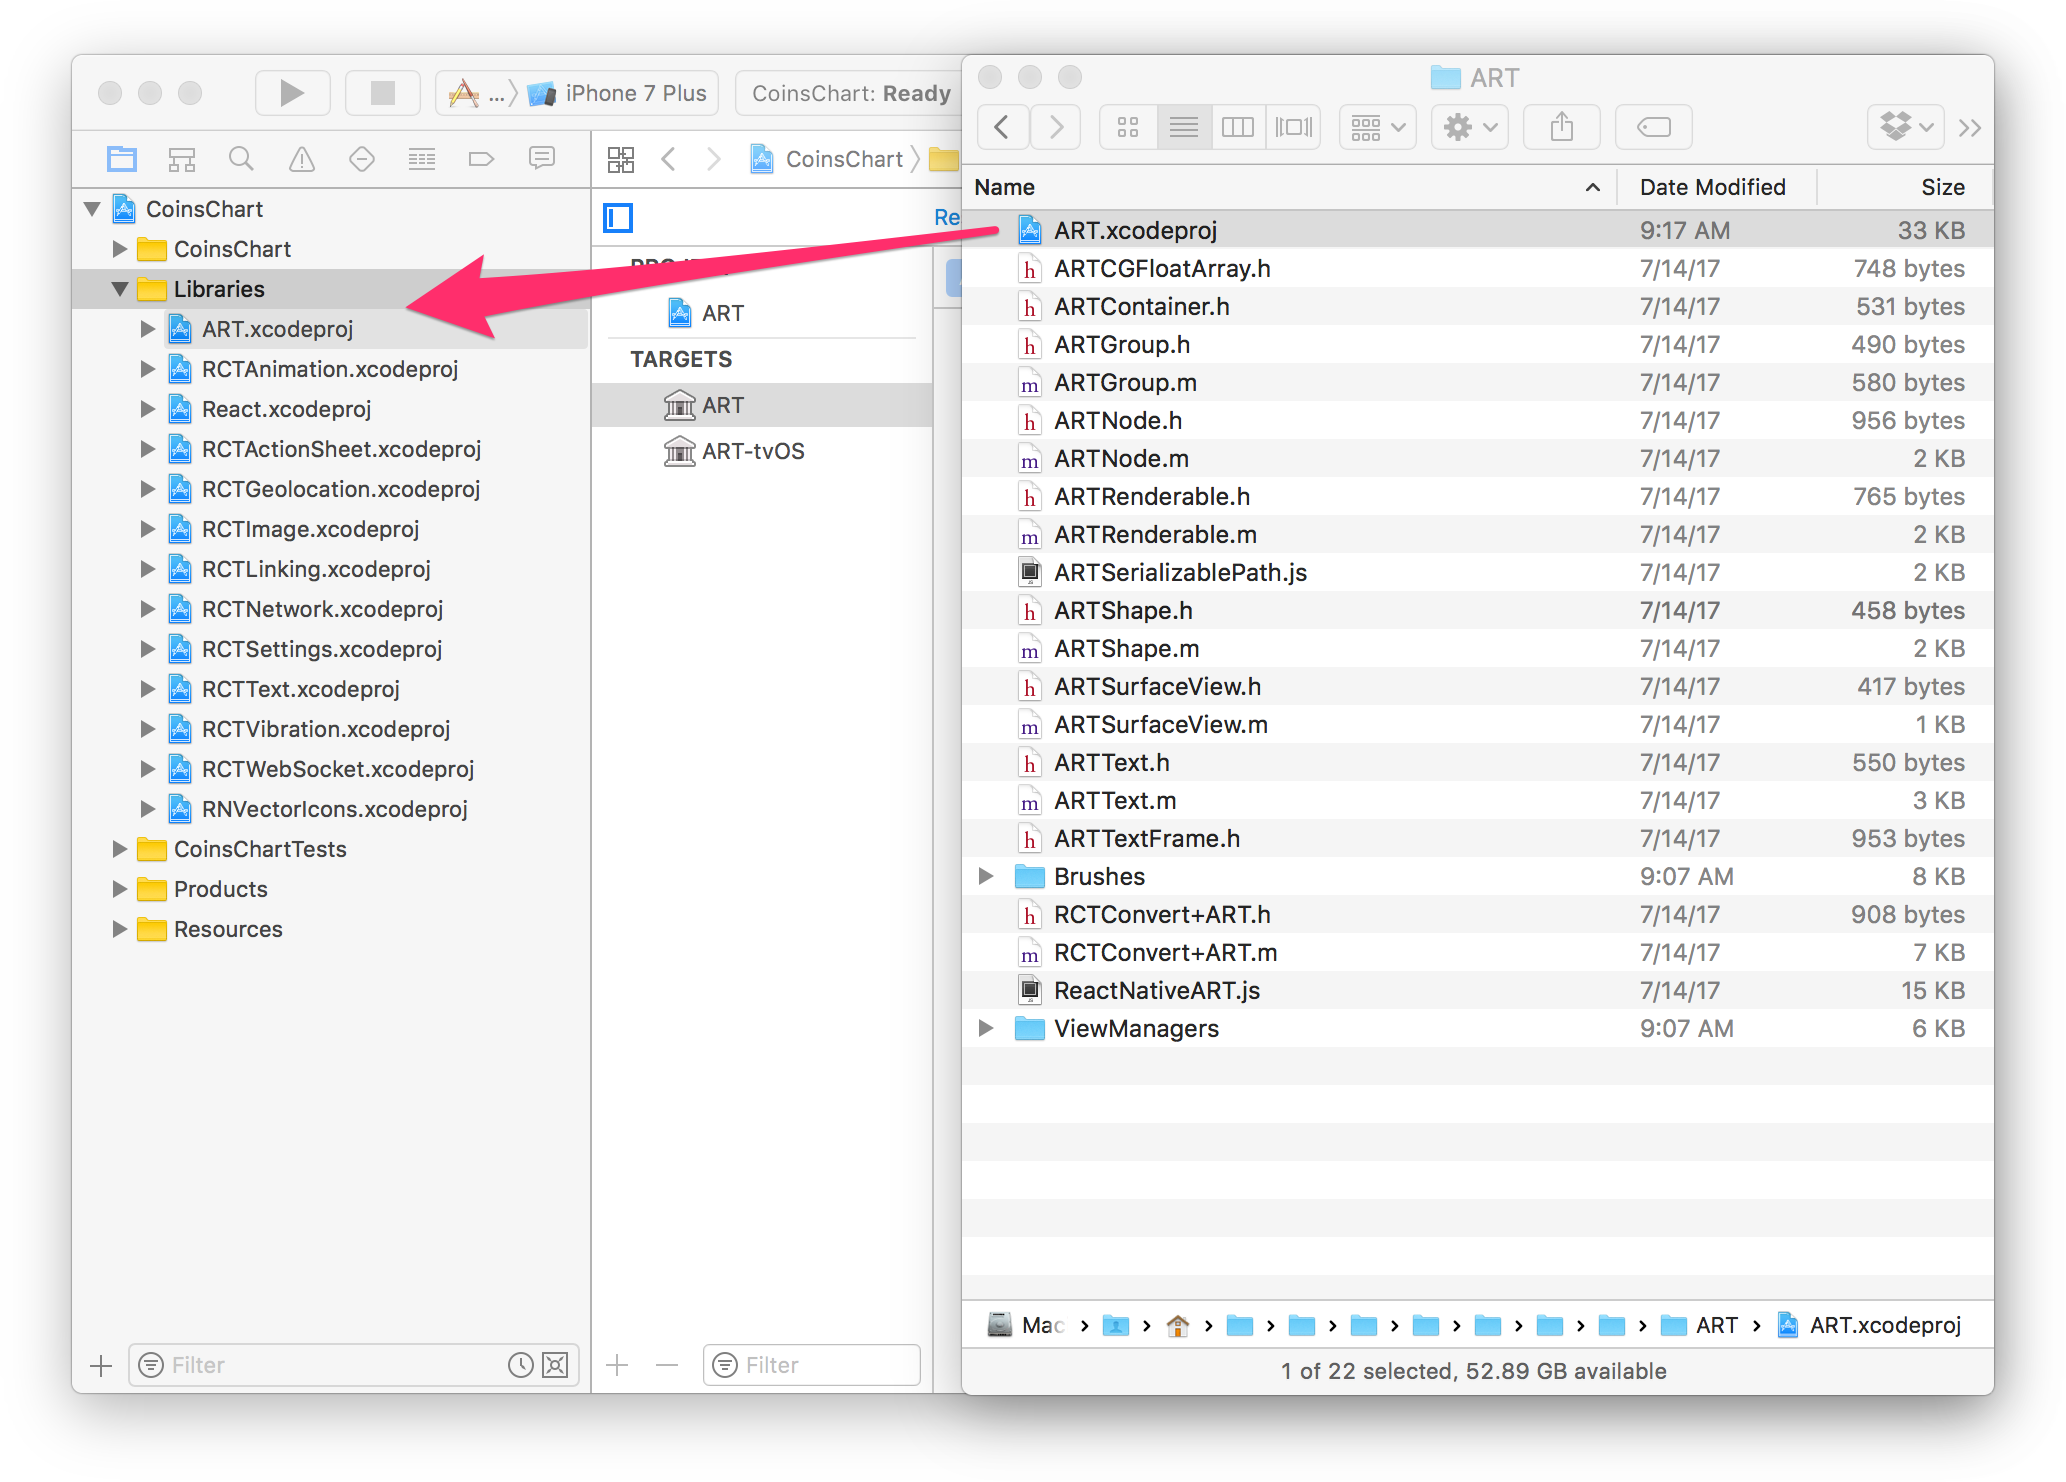
CoinsChart.xcodeprojfromiosfolder. - Find
ART.xcodeprojfile innode_modules/react-native/Libraries/ARTfolder. - Drag
ART.xcodeprojintoLibrariesfolder.
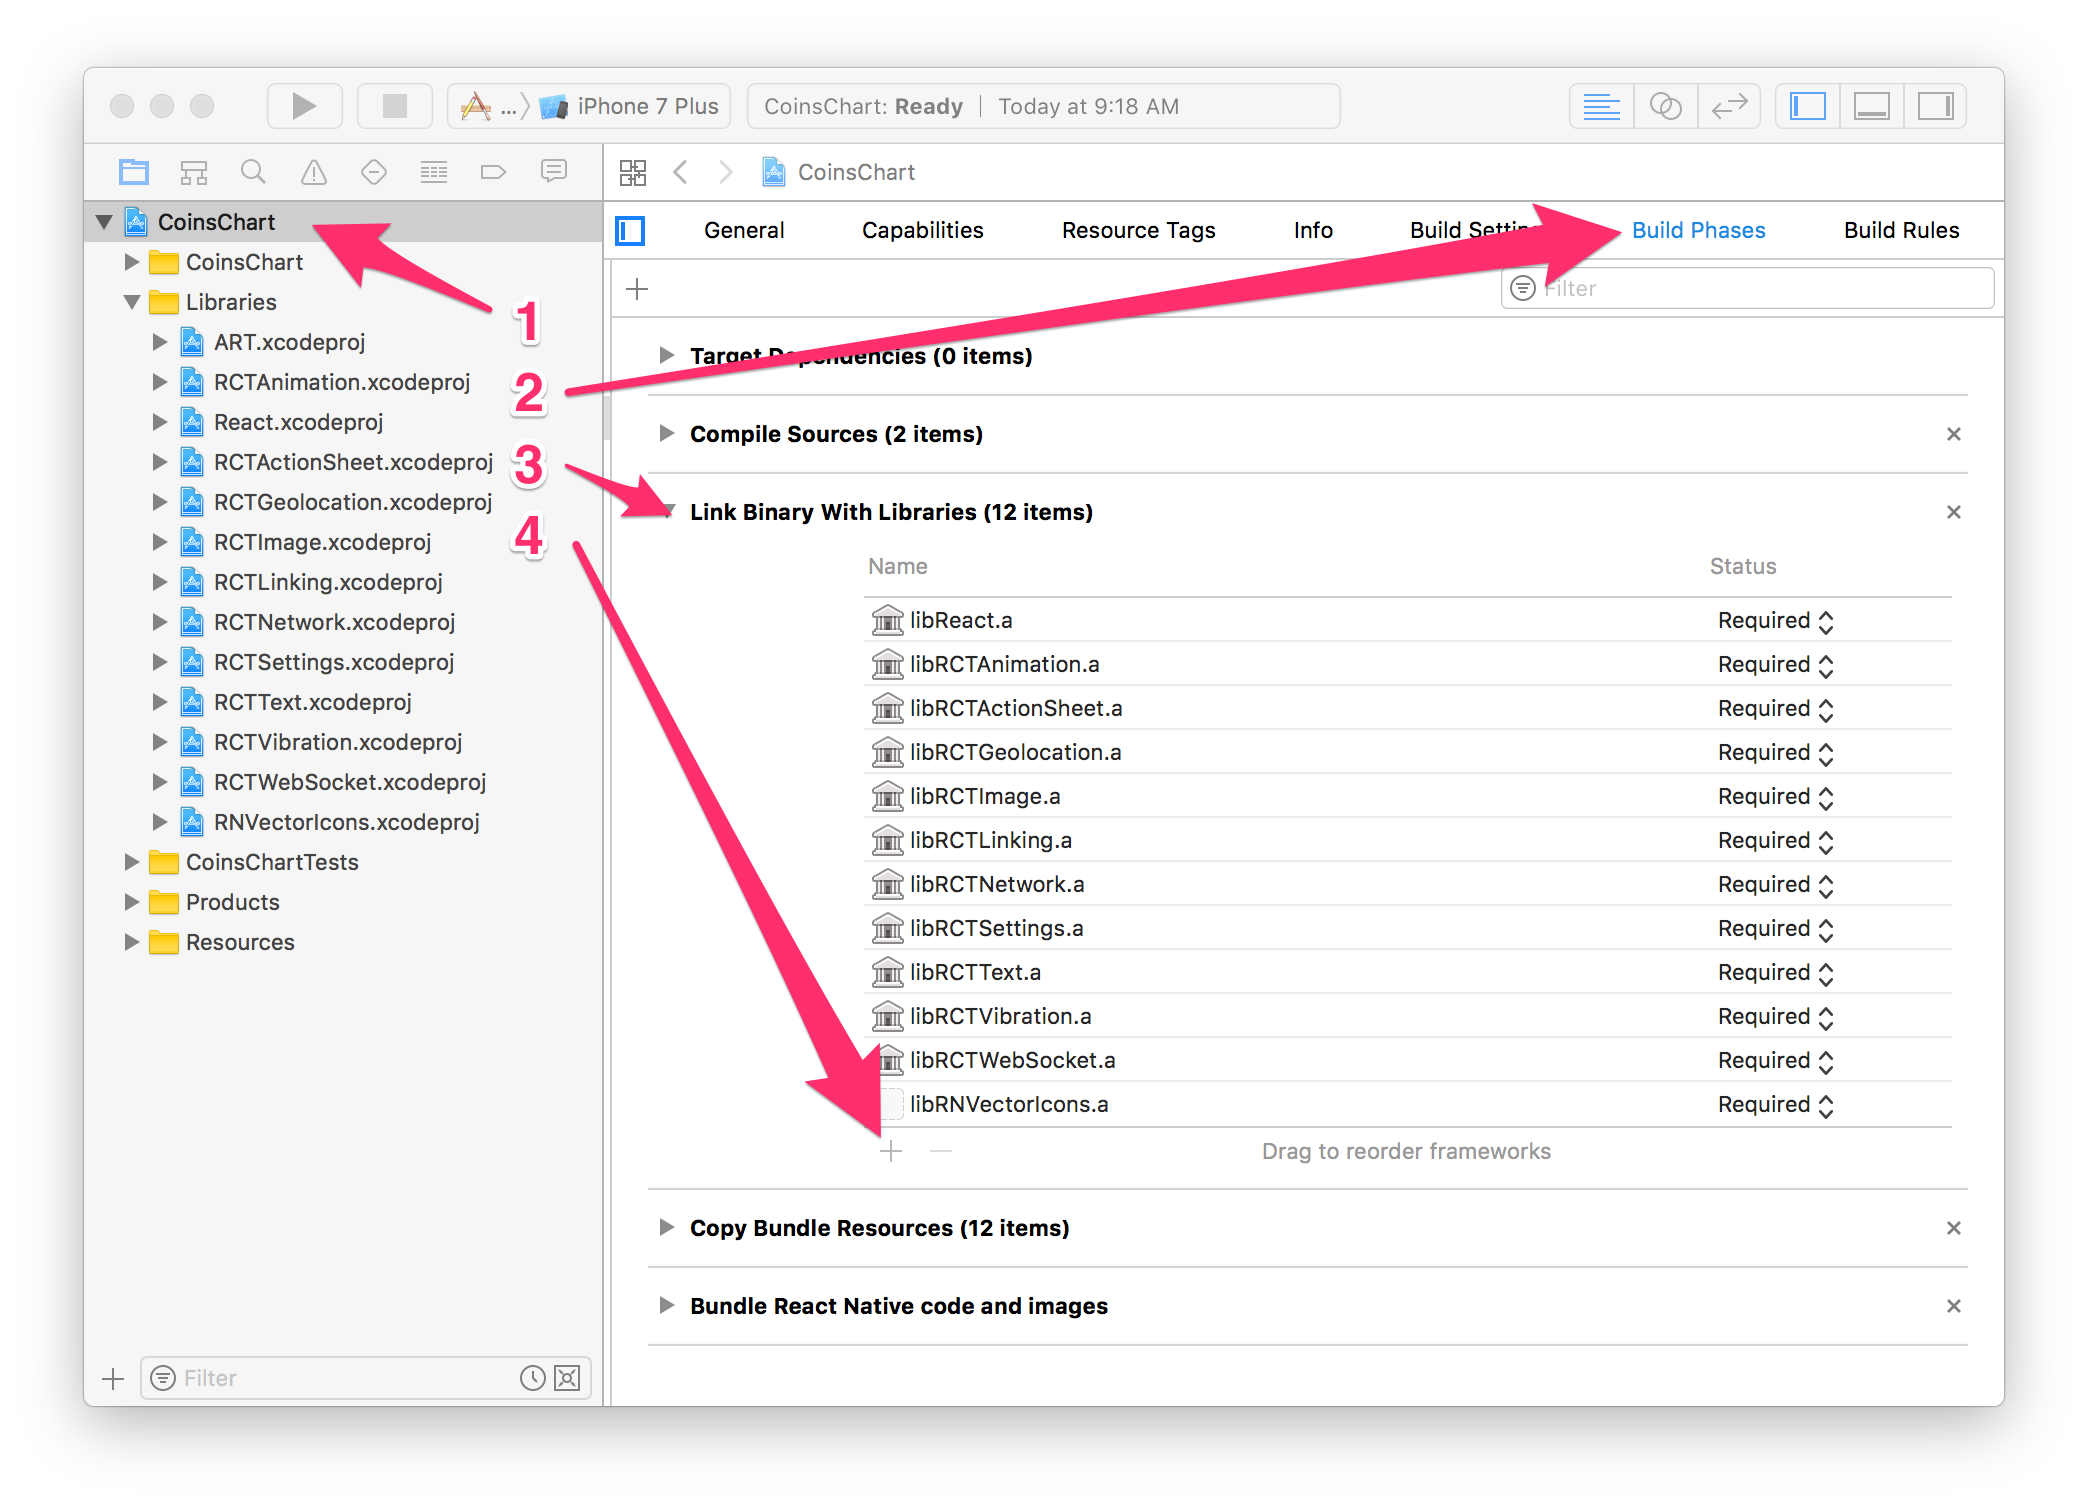
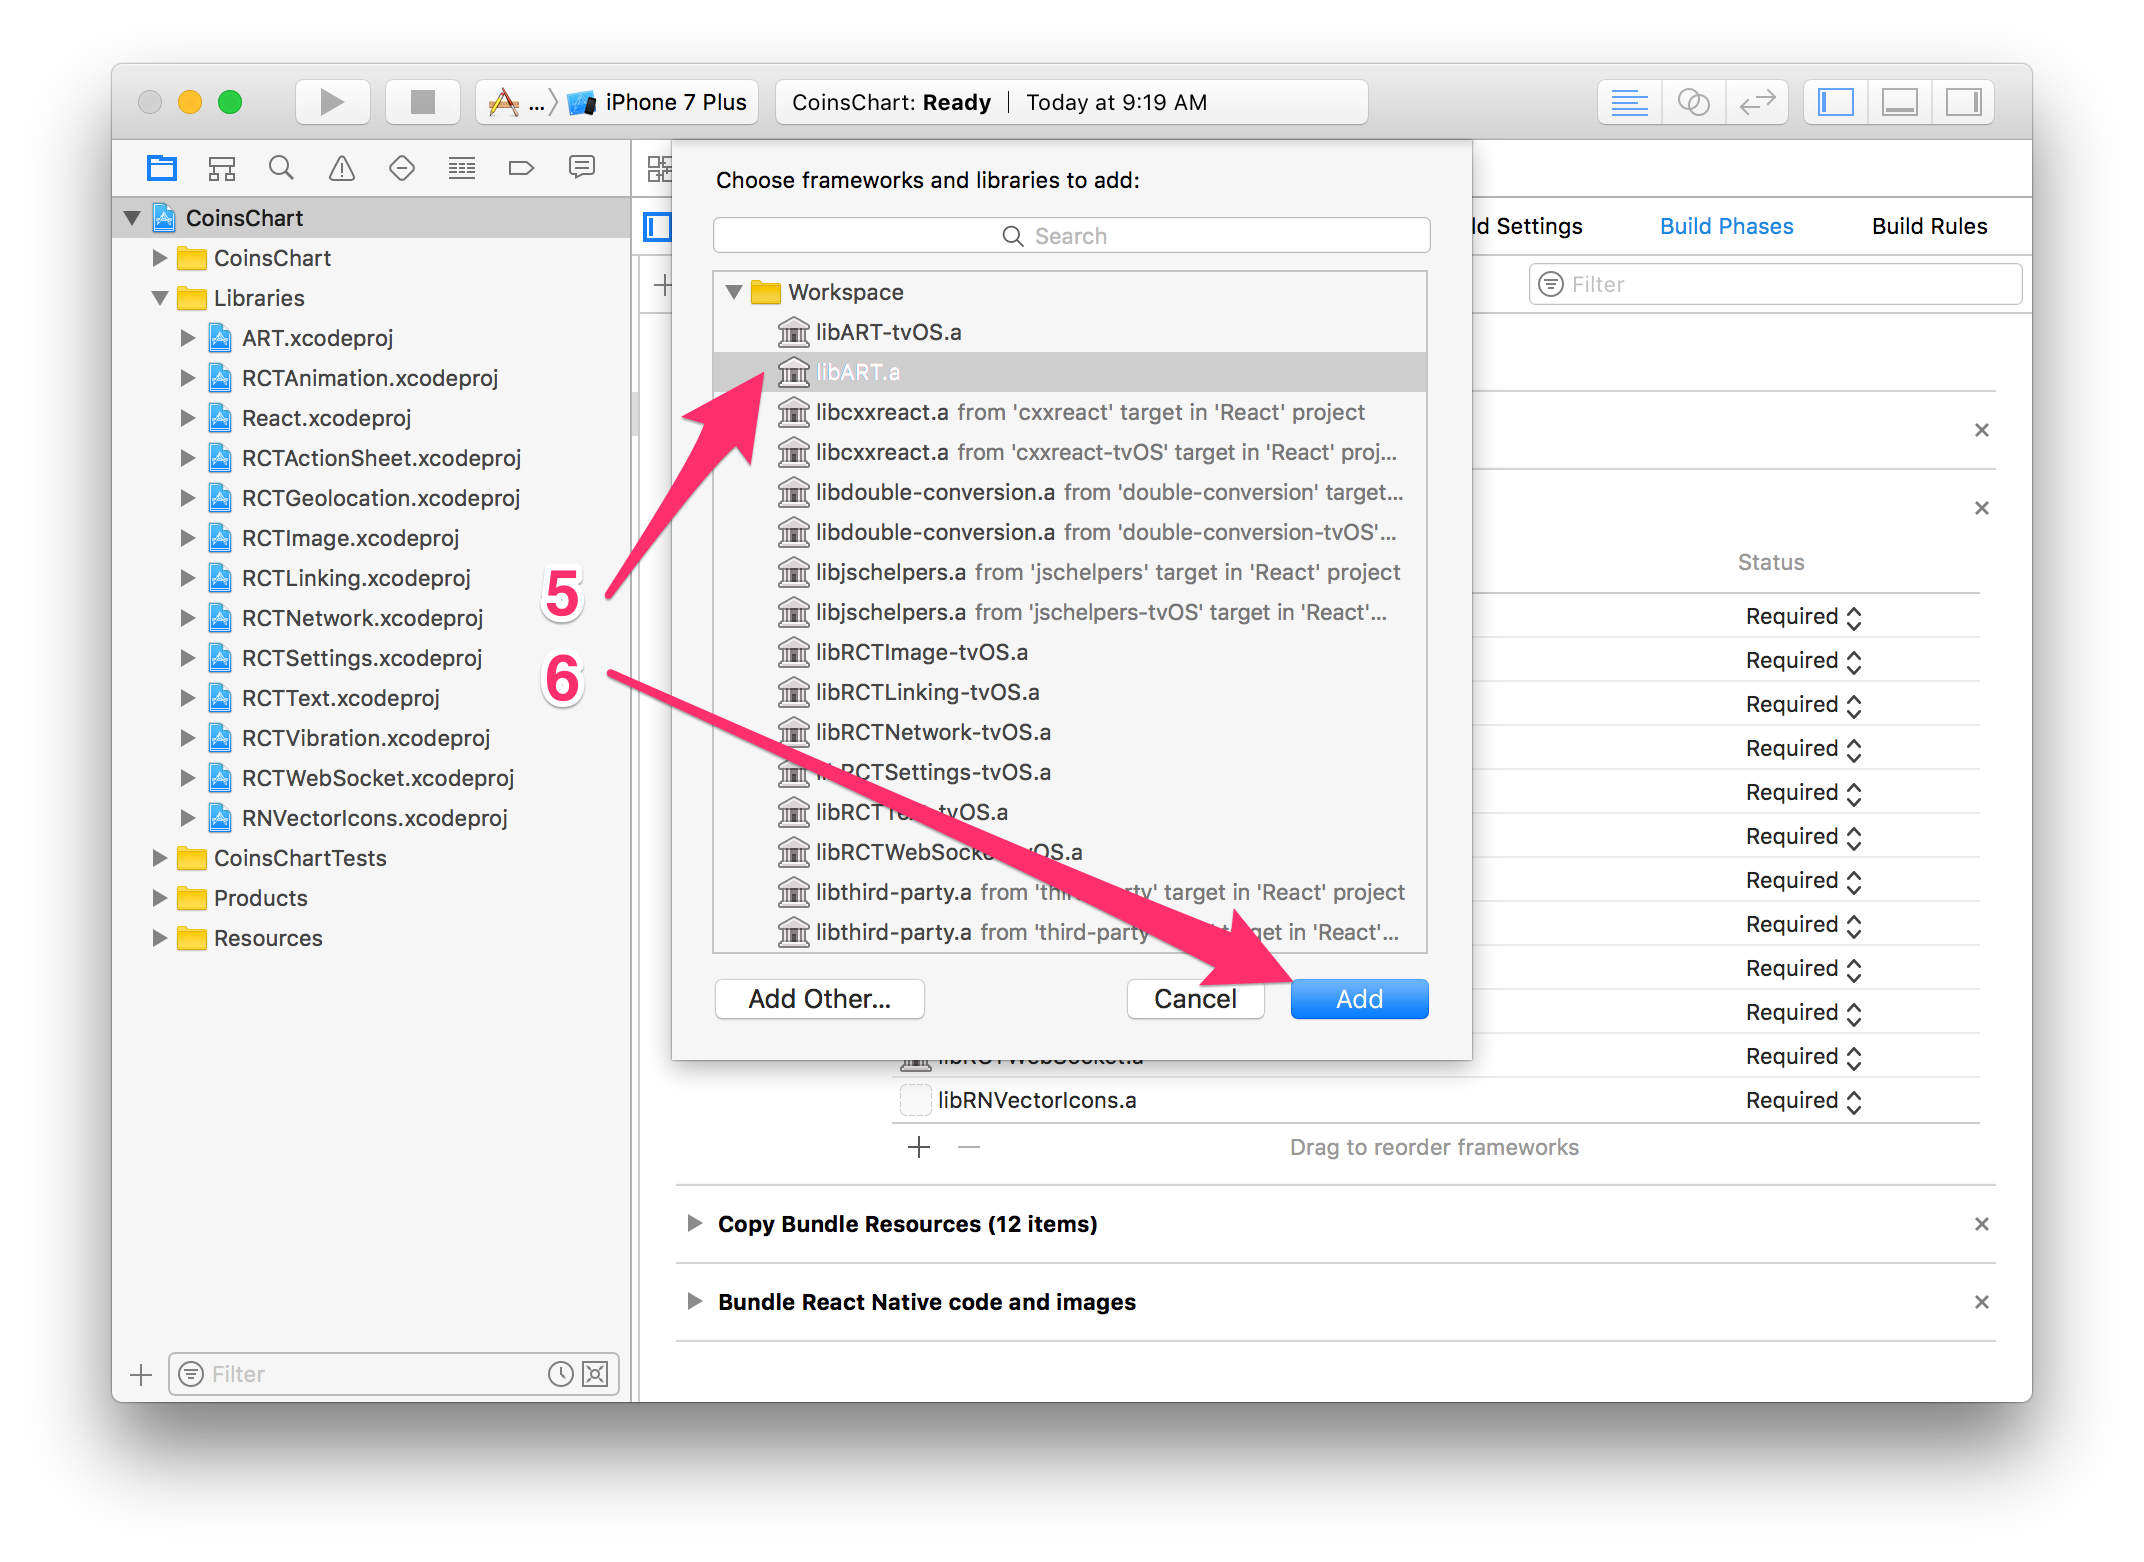
- Link
libART.awith binary.
Flow
Flow is a static type checker for JavaScript. We’ll be using it to type hint React component, Redux actions, reducers, etc. Flow improves code readability, finds errors instantly, and allows you to refactor code more confidently, which especially important as you app grows bigger.
npm install --save-dev [email protected] babel-cli babel-preset-flow;
- Open
.babelrcfile and addflowtopresets:
{
  "presets": ["react-native", "flow"],
  "plugins": ["transform-decorators-legacy"]
}
- Open
package.jsonfile and addflowtoscriptspart:
{
  // ...
  "scripts": {
    "start": "node node_modules/react-native/local-cli/cli.js start",
    "test": "jest",
    "flow": "flow" // add this
  },
  // ...
}
- Open Terminal and run
npm run flow. You should seeNo errors!message.
npm run flow
Redux DevTools Extension
This extension allows debugging Redux remotely with Chrome, Firefox, React Native Debugger, etc.
npm install --save-dev redux-devtools-extension
Launch the Simulator
Now, let’s run the app in the simulator.
react-native run-ios;
Making debugging easier
Let’s do a couple of things to simplify debugging and make our lives easier.
Enable hot reloading
Once your app is up and running, press ⌘D in the simulator and select Enable Hot Reloading. This will save you some time having to reload the app manually every time you make a change.
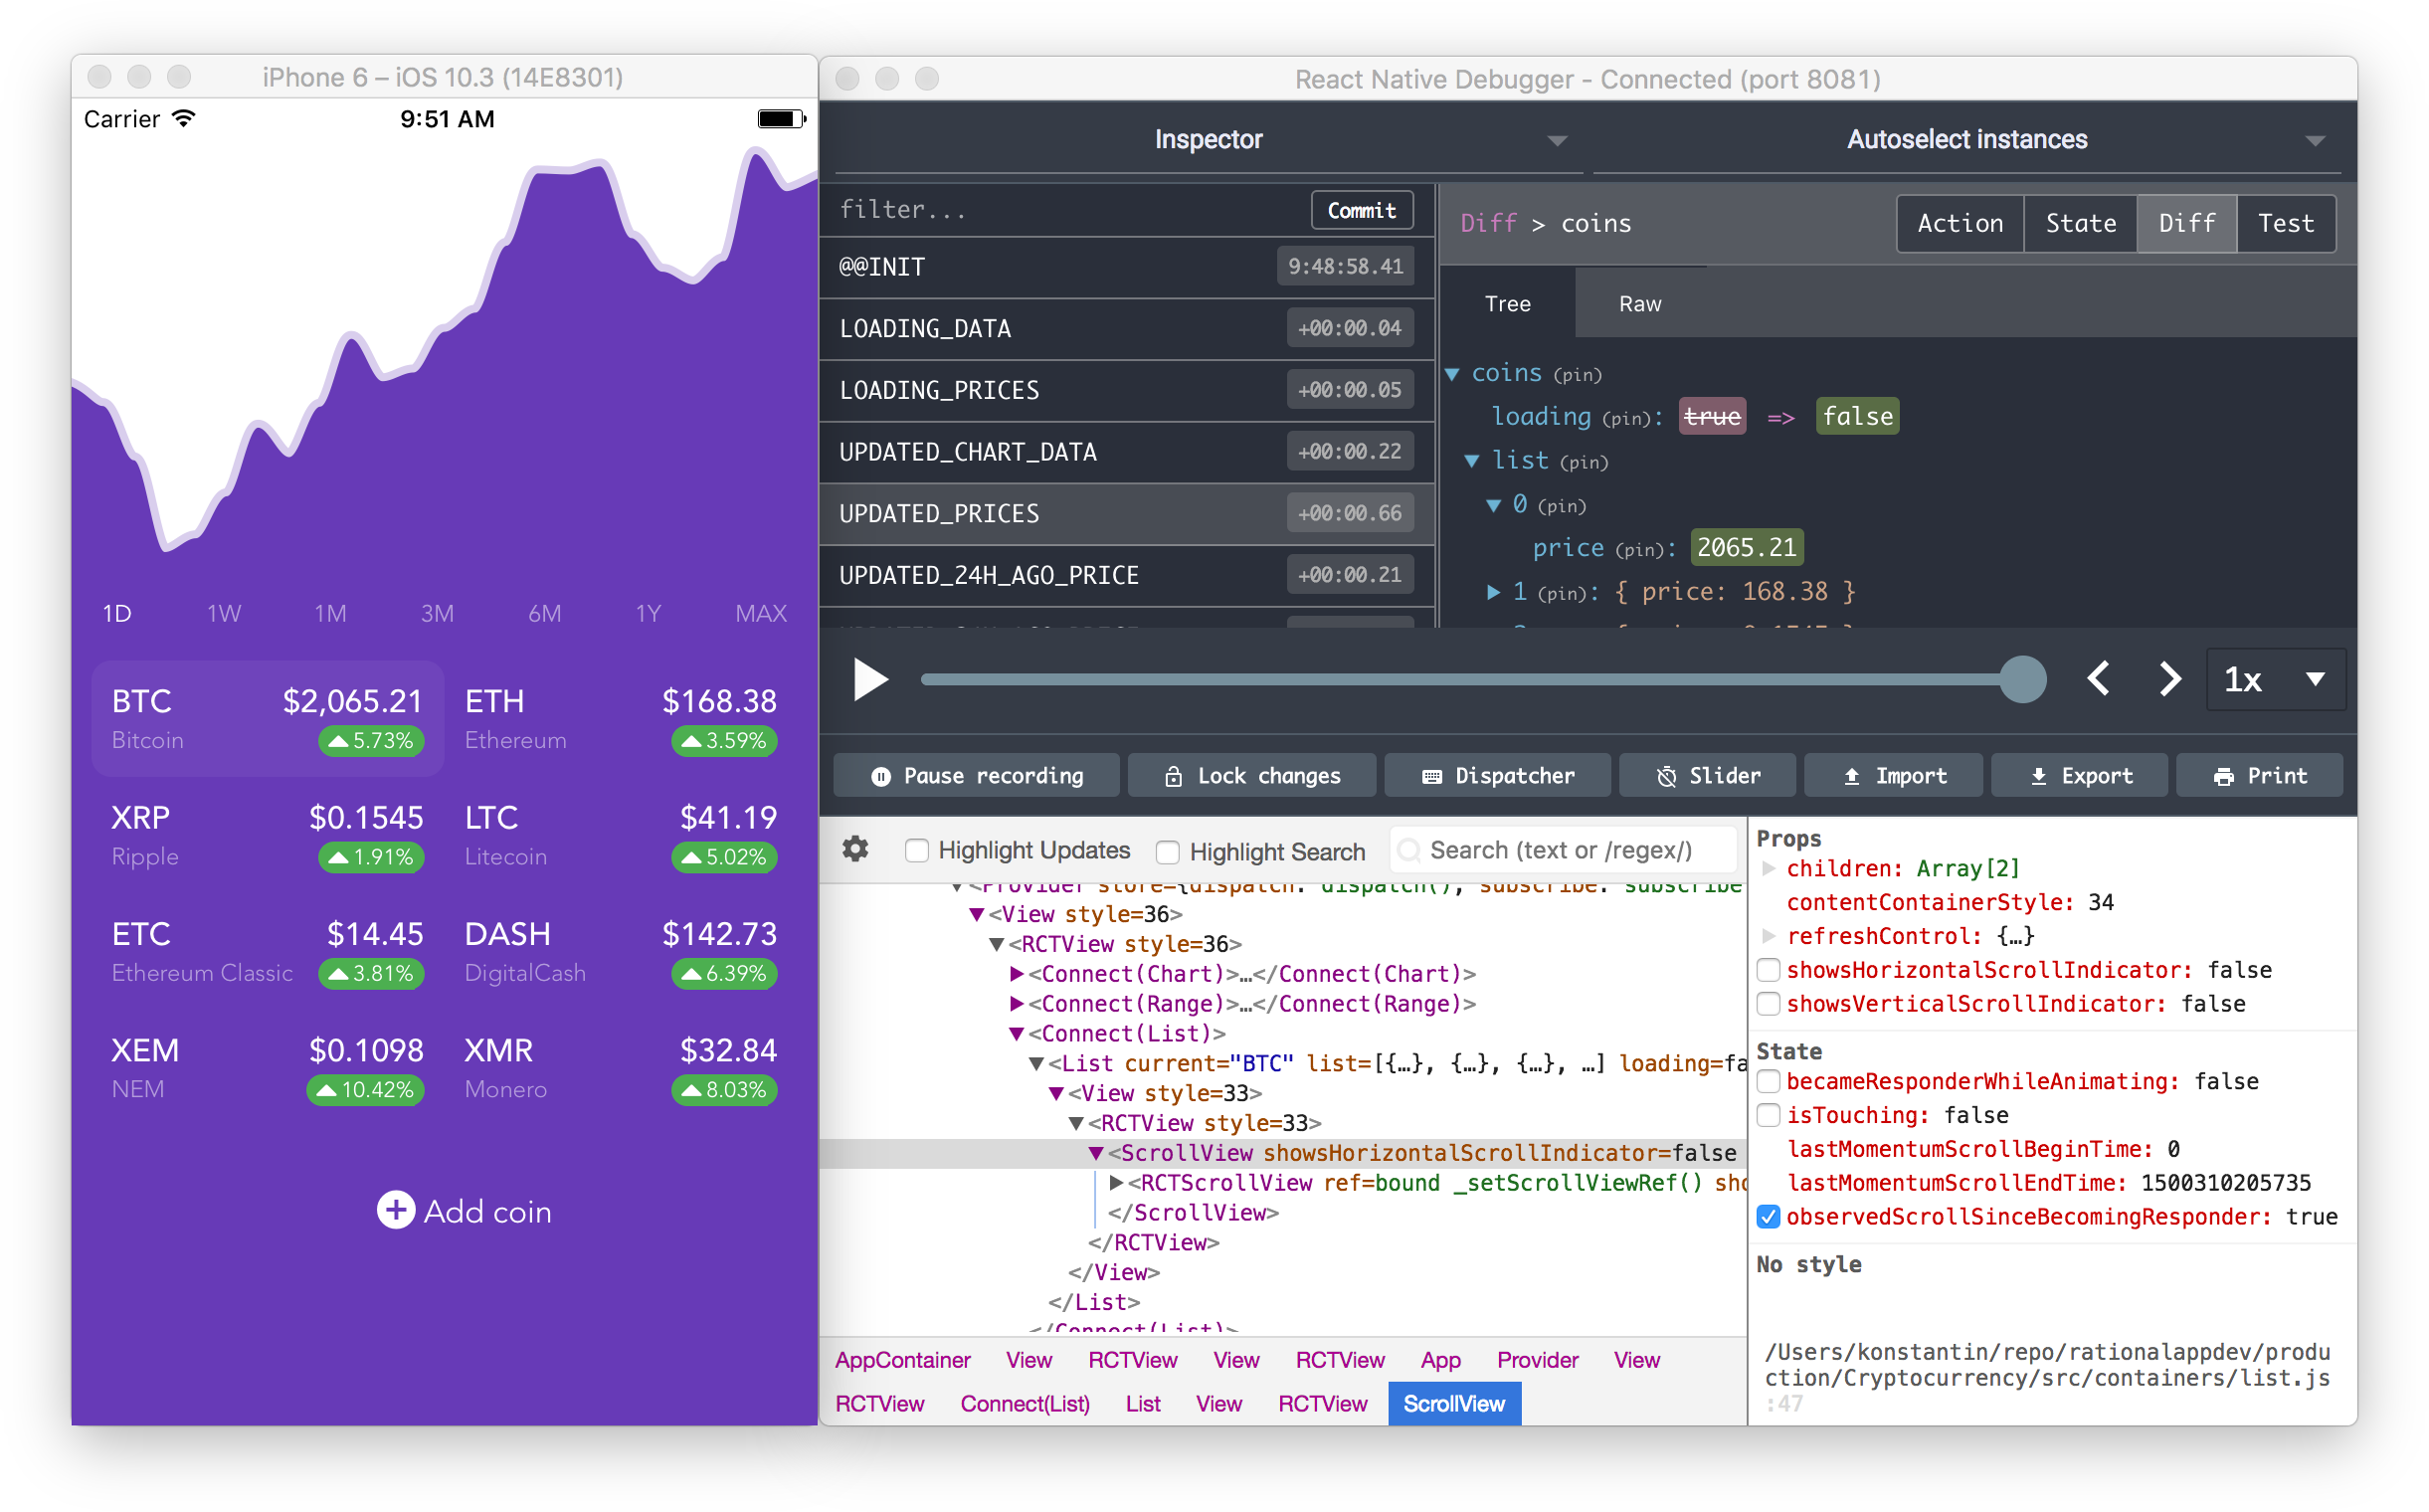
Install React Native Debugger
This is a standalone app for debugging React Native apps. It includes React Inspector and Redux DevTools. It makes debugging React Native apps a breeze!
Install with brew on OS X:
brew update && brew cask install react-native-debugger
Prebuilt binaries for other platforms can be found here
To enable debugger, launch it first, press ⌘D in the simulator and select Debug JS Remotely.
Breaking design layout down
Let’s take a break from installing stuff and take a look at our design layout.
Before starting coding, we want to break everything down into separate components visually. It helps with code organization and with understanding how everything fits together and which React Native components to use for each part.
Starting coding
- Create a new folder called
src. We’ll be creating all new source files and folders within this folder.
Index files
Next, let’s update our index files. Since we’re going to reuse the same code for both, iOS and Android, we don’t need two different index files. We’ll create App component and reuse it for both.
- Open
index.ios.jsfile and scrap all of the React Native boilerplate code to start from scratch. Do the same forindex.android.js. And add the following code to both of those files.
import { AppRegistry } from 'react-native';
import App from './src/app';

AppRegistry.registerComponent('CoinsChart', () => App);
This code imports App component from src/app.js file and registers it as the main app component.
App component
Now, let’s create our main component. For now, it’ll just render a blank view.
- Create a new file called
app.jswithinsrcfolder.
import React, { Component } from 'react';
import {
  StyleSheet,
  View
} from 'react-native';

export default class App extends Component {
  render() {
    return (
      <View style={styles.container}>

      </View>
    );
  }
}

const styles = StyleSheet.create({
  container: {
  flex: 1,        // take up the whole screen
    paddingTop: 20, // put content below status bar
  },
});
Containers
Next, let’s create those three main container components that you can see on the left side of the design layout breakdown. Those are Chart, Date Ranges and Scrollable List.
- Create a new folder called
containerswithinsrcfolder.
In that folder, we’ll be storing so called containers. They’re different from regular presentational components because they work with Redux storage. They connect to Redux storage, get some data from it, process it if needed and pass the data down to presentational components. Those containers are marked red on the design layout breakdown diagram.
Chart container
- Create a new file called
chart.jswithinsrc/containersfolder.
import React, { Component } from 'react';
import {
  StyleSheet,
  View
} from 'react-native';

export default class Chart extends Component {

  render() {
    return (
      <View style={styles.container}>

      </View>
    );
  }

}

const styles = StyleSheet.create({
  container: {
    flex: 38, // take 38% of the screen height
    backgroundColor: '#FFFFFF',
  },
});
Ranges container
- Create a new file called
ranges.jswithinsrc/containersfolder.
import React, { Component } from 'react';
import {
  StyleSheet,
  View
} from 'react-native';

export default class Ranges extends Component {

  render() {
    return (
      <View style={styles.container}>

      </View>
    );
  }

}

const styles = StyleSheet.create({
  container: {
    backgroundColor: '#673AB7',
  },
});
List container
- Create a new file called
list.jswithinsrc/containersfolder.
import React, { Component } from 'react';
import {
  StyleSheet,
  View
} from 'react-native';

export default class List extends Component {

  render() {
    return (
      <View style={styles.container}>

      </View>
    );
  }

}

const styles = StyleSheet.create({
  container: {
    flex: 62, // take 62% of the screen height
    backgroundColor: '#673AB7',
  },
});
Update App component
Next, let’s update App component to make it render those three containers we just created.
- Open
app.jsfile withinsrcfolder and add highlighted lines.
import React, { Component } from 'react';
import {
  StyleSheet,
  View
} from 'react-native';
import Chart from './containers/chart';
import Ranges from './containers/ranges';
import List from './containers/list';

export default class App extends Component {
  render() {
    return (
      <View style={styles.container}>
        <Chart />
        <Ranges />
        <List />
      </View>
    );
  }
}

const styles = StyleSheet.create({
  container: {
    flex: 1,        // take up the whole screen
    paddingTop: 20, // put content below status bar
  },
});
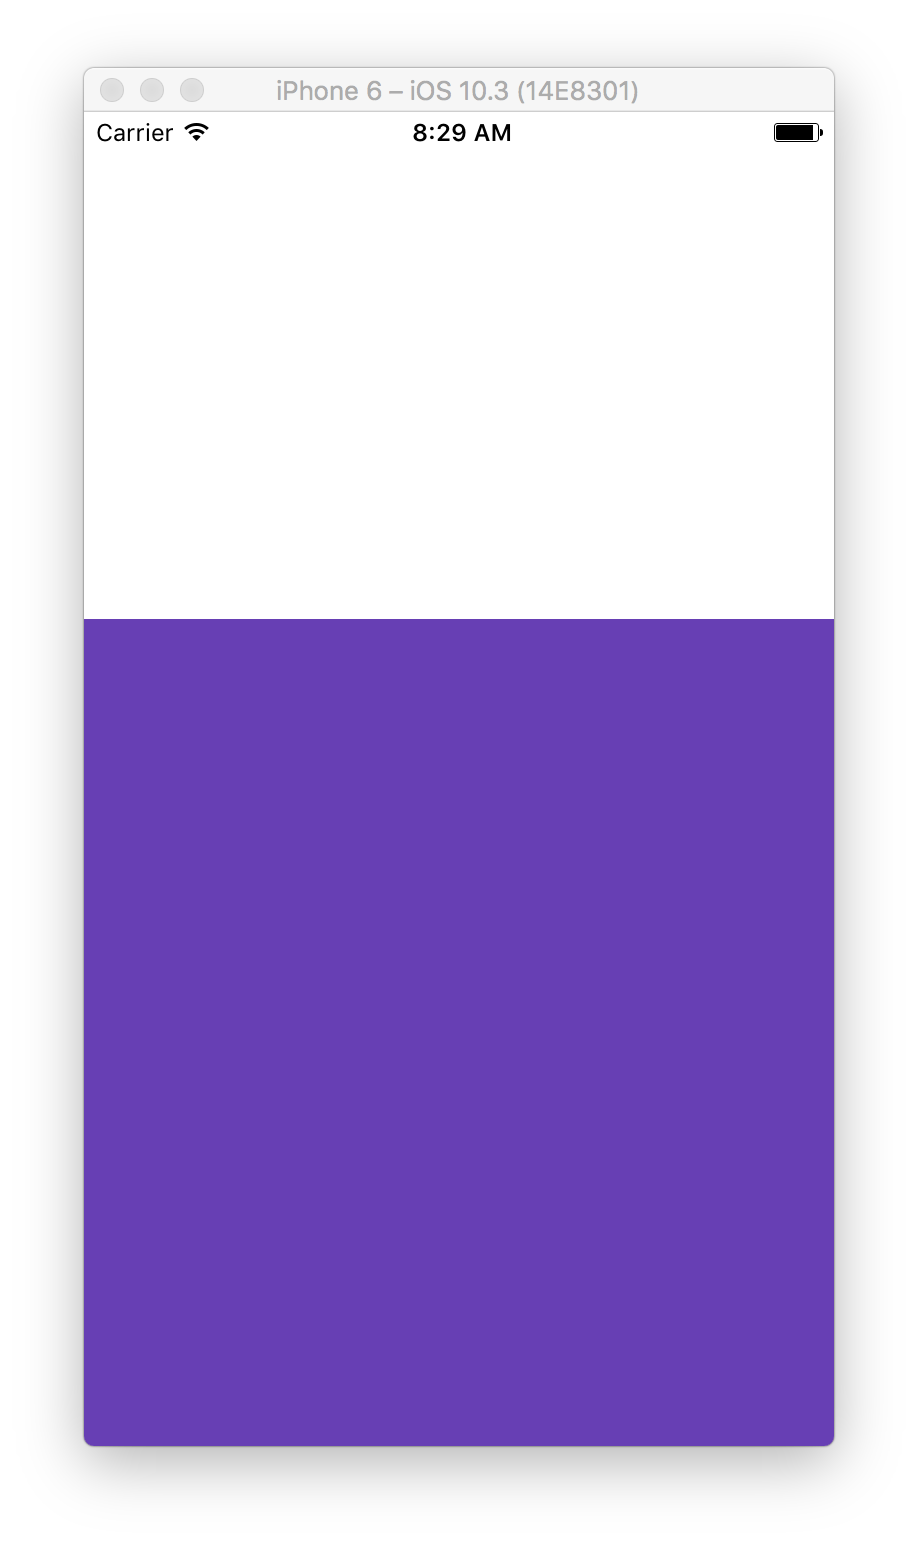
Bring up the Simulator to check out the progress. Now we have our three containers with different backgrounds. We’re getting closer. Let’s keep going.
Components
Let’s create a folder for storing regular presentational components. Presentational components are not aware of the Redux storage, API calls, etc. They just render whatever data we pass down. Those are marked orange and blue on the design layout breakdown diagram.
- Create a new folder called
containerswithinsrcfolder.
Chart component
Next, let’s build a component that renders charts. We want it to take in an array of prices as a prop and render a chart for those prices.
Technically we want to have an area chart in the end. But, we’ll call it a line chart and add a prop called fill that takes in color and fills the area below the line making it an area chart. So it can be either a line chart with transparent filling or an area chart with a solid color filling.
- Create a new folder called
chartwithinsrc/componentsfolder. We’ll use it for storing all of the chart related components. - Create a new file called
line.jswithinsrc/components/chartfolder. For now, we’re going to have just one chart component that renders a line/area chart.
// @flow

import React, { Component } from 'react';
import {
  Dimensions,
  LayoutAnimation,
  StyleSheet,
  View
} from 'react-native';
import {
  Group,
  Path,
  Surface,
  Shape
} from 'react-native/Libraries/ART/ReactNativeART';

export default class Line extends Component {

  props: {
    values: Array<number>,
    fillColor: string,
    strokeColor: string,
    strokeWidth: number,
  };

  static defaultProps = {
    fillColor: 'rgba(103, 58, 183, 1)',       // solid violet color
    strokeColor: 'rgba(103, 58, 183, 0.25)',  // semi-transparent violet
    strokeWidth: 8,
  };

  state = {
    // set initial width to screen width so when animated it stays constant,
    // try setting it to zero and see what happens on initial load
    width: Dimensions.get('window').width,
    // set initial height to zero so when updated to actual height and
    // animated, the chart raises from the bottom to the top of the container
    height: 0,
  };

  componentWillUpdate() {
    LayoutAnimation.configureNext(LayoutAnimation.Presets.easeInEaseOut);
  }

  // Handle container view's onLayout event to get its width and height after rendered and
  // update the state so the component can render the chart using actual width and height
  onLayout = (event: Object) => {
    // pull out width and height out of event.nativeEvent.layout
    const {
      nativeEvent: {
        layout: {
          width,
          height
        }
      }
    } = event;
    // update the state
    this.setState({
      width,
      height,
    })
  };

  buildPath = (values: Array<number>): Path => {
    const {
      strokeWidth,
    } = this.props;
    const {
      width,
      height,
    } = this.state;

    let firstPoint: boolean = true,
      // holds x and y coordinates of the previous point when iterating
      previous: { x: number, y: number };

    const
      minValue = Math.min(...values),
      maxValue = Math.max(...values) - minValue,
      // step between each value point on horizontal (x) axis
      stepX = width / (values.length - 1 || 1),
      // step between each value point on vertical (y) axis
      stepY = maxValue
        ? (height - strokeWidth * 2) / maxValue
        : 0,
      // adjust values so that min value becomes 0 and goes to the bottom edge
      adjustedValues = values.map(value => value - minValue)
    ;

    let path = Path()
    // start from the left bottom corner so we could fill the area with color
      .moveTo(-strokeWidth, strokeWidth);

    adjustedValues.forEach((number, index) => {
      let x = index * stepX,
        y = -number * stepY - strokeWidth;
      if (firstPoint) {
        // straight line to the first point
        path.lineTo(-strokeWidth, y);
      }
      else {
        // make curved line
        path.curveTo(previous.x + stepX / 3, previous.y, x - stepX / 3, y, x, y);
      }
      // save current x and y coordinates for the next point
      previous = { x, y };
      firstPoint = false;
    });

    return path
      // line to the right bottom corner so we could fill the area with color
      .lineTo(width + strokeWidth, strokeWidth)
      .close();
  };

  render() {
    const {
      values,
      fillColor,
      strokeColor,
      strokeWidth
    } = this.props;
    const {
      width,
      height,
    } = this.state;
    return (
      <View
        style={styles.container}
        onLayout={this.onLayout}
      >
        <Surface width={width} height={height}>
          <Group x={0} y={height}>
            <Shape
              d={this.buildPath(values)}
              fill={fillColor}
              stroke={strokeColor}
              strokeWidth={strokeWidth}
            />
          </Group>
        </Surface>
      </View>
    );
  }

}

const styles = StyleSheet.create({
  container: {
    flex: 1,
    // align at the bottom of the container so when animated it rises to the top
    justifyContent: 'flex-end',
  },
});
When this component gets rendered, this.onLayout is getting called and it gets the component’s width and height. We need those to render the chart, and we couldn’t know them in advance because we’re using Flexbox for layout and not absolute values. That’s why we’re using onLayout event of View component.
There’s only one required props values. It expects an array of numbers. Note how we didn’t mark the rest of the props as optional with Flow. That’s because we have default values for those set within defaultProps. Otherwise, we’d mark optional props with a question mark, for instance fillColor?: string.
We’re also using React Native’s LayoutAnimation component to automatically animate layout changes. Initially, component has a height of 0, but after onLayout event gets triggered and updates the height LayoutAnimation animates the height change and the chart rises from the bottom of the container to the top.
And to render the chart itself we’re using a few components of ART library, including Surface to define an area of a certain width and height for the chart, Group that takes all the surface space, and Shape to draw and fill the chart.
Updating Chart container
Ok, let’s see how that chart looks!
- Open up
chart.jsfile withinsrc/containersfolder to make some changes. - First of all, we need to import our newly created
Linecomponent.
// existing imports
import Line from '../components/chart/line';
- And second, let’s add
Linewith some random values inside<View style={styles.container}>ofrender()just to see how it works.
    <View style={styles.container}>
        <Line values={[40, 30, 70, 60, 100, 70, 40, 70, 50]} />
      </View>
Alright, bring up the simulator and press press ⌘R to reload the app.

Wrapping up
And that’s it for the part 1. Check out Part 2 to find out how to set up Redux store, get coin prices through the API and build a list of coins.


Pingback: Charts in React Native (Part 2) | Rational App Development()